
Evidence graphics · Investigation domains
How Digital Asset Claims visualises a digital asset investigation
Five themed carousels grouped by investigation domain: transaction tracing, wallet and entity clustering, OSINT and infrastructure mapping, evidence timelines and reporting, and the correlation engines that tie a case together. Every visual on this page reflects the methodology behind an active case file.
Transaction Tracing
Following funds across wallets, chains and mixers
Transaction graphs and ledger abstractions reconstructed from on-chain data to establish the movement of value between addresses.
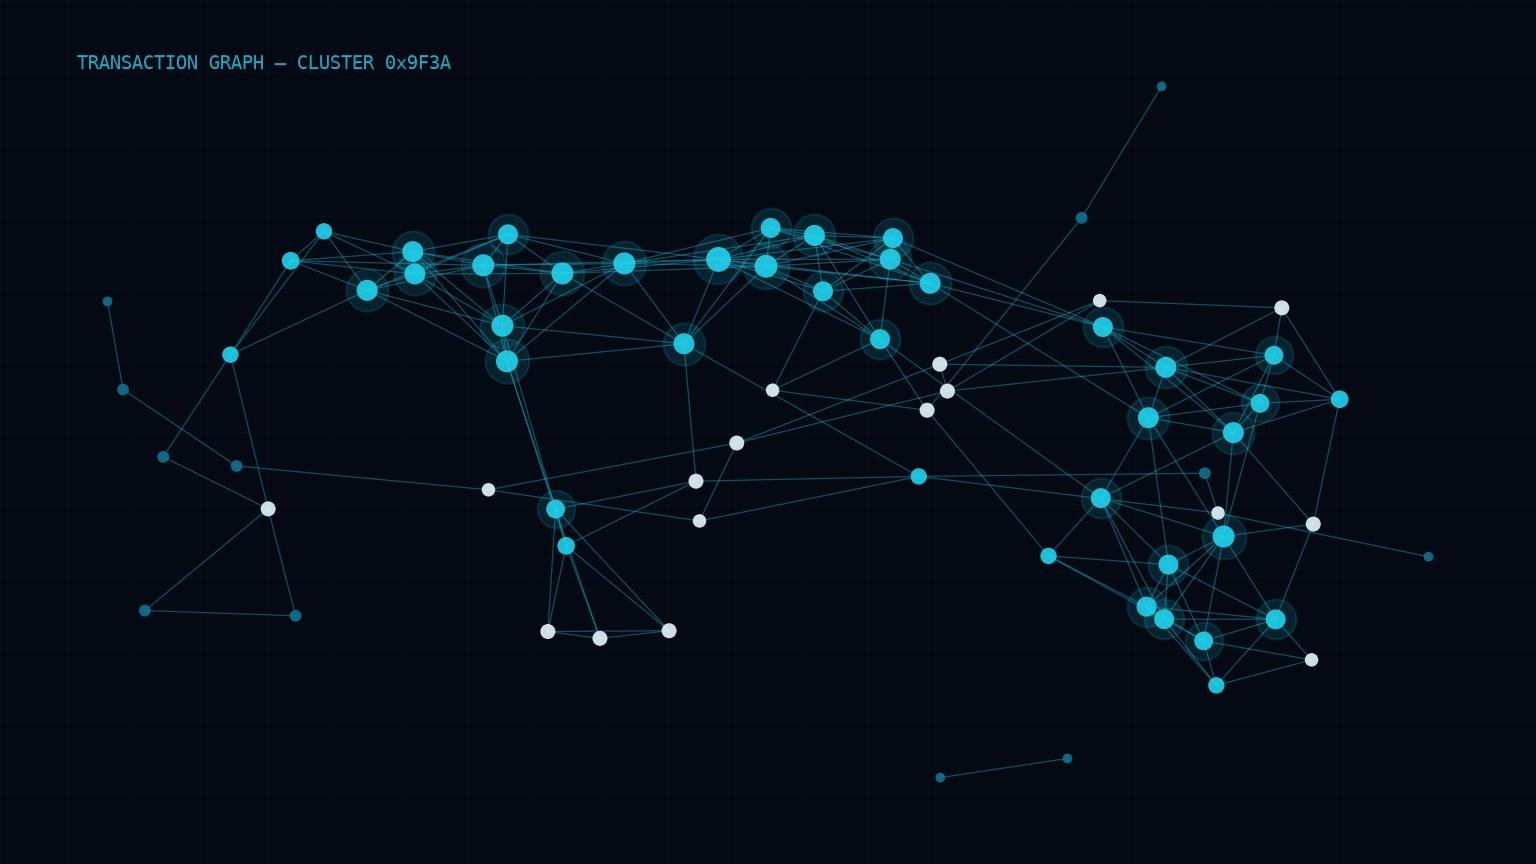
01 · Transaction Tracing
Transaction graph network
Linked wallet-to-wallet transfers mapped across a traced cluster.
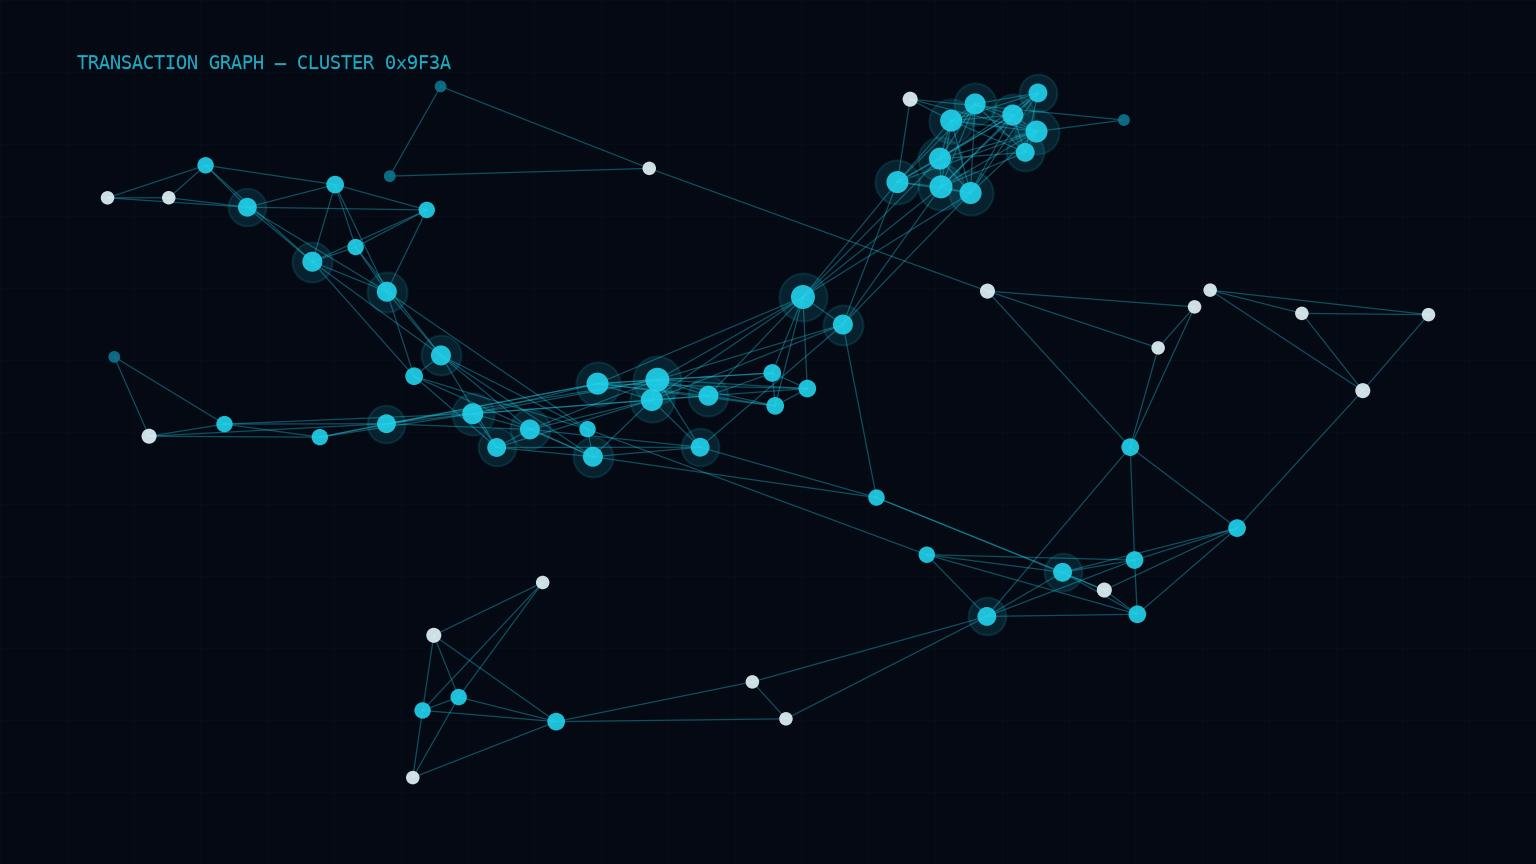
02 · Transaction Tracing
Secondary transaction flow
A related address cluster feeding back into the primary trace.
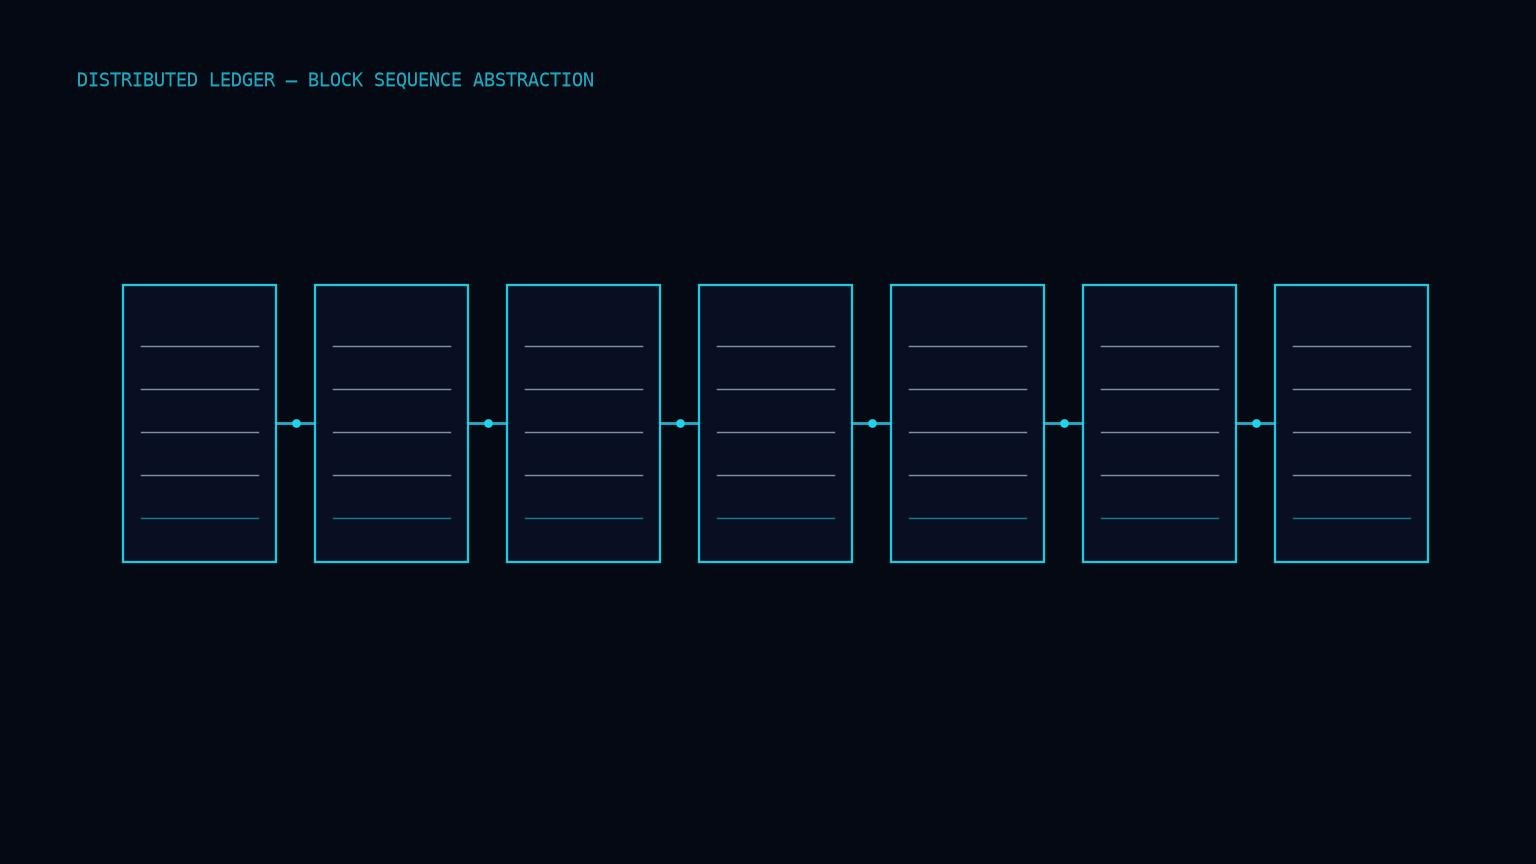
03 · Transaction Tracing
Blockchain ledger abstraction
The sequential block structure underlying every on-chain record.
Wallet & Entity Clustering
Grouping addresses into the entities that control them
Clustering heuristics and relationship mapping link wallets, shell companies and accounts into a single behavioural picture.
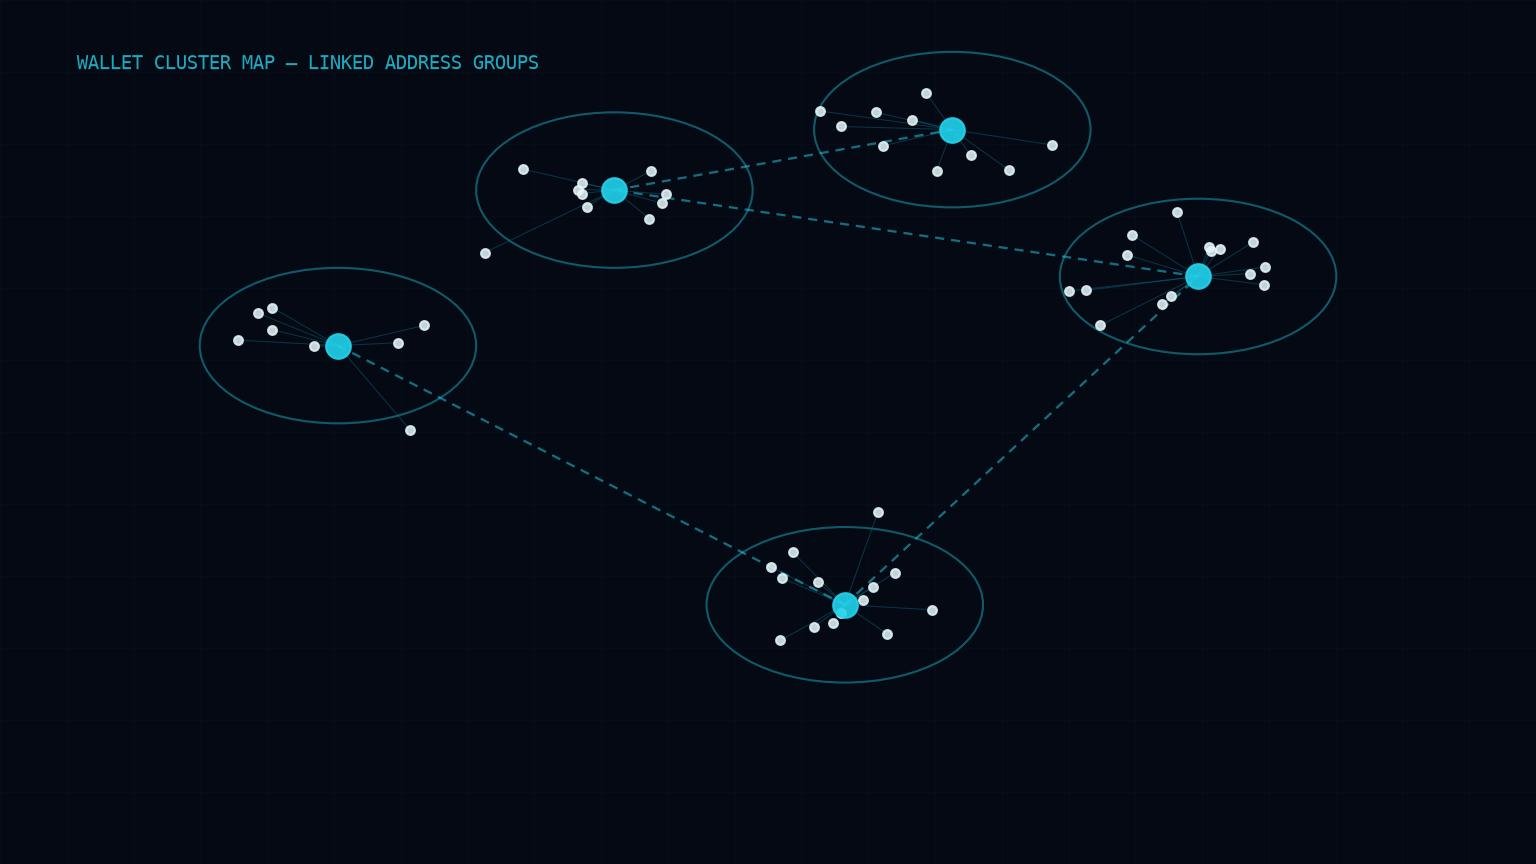
01 · Wallet & Entity Clustering
Wallet cluster map
Related addresses grouped by shared control during an investigation.
02 · Wallet & Entity Clustering
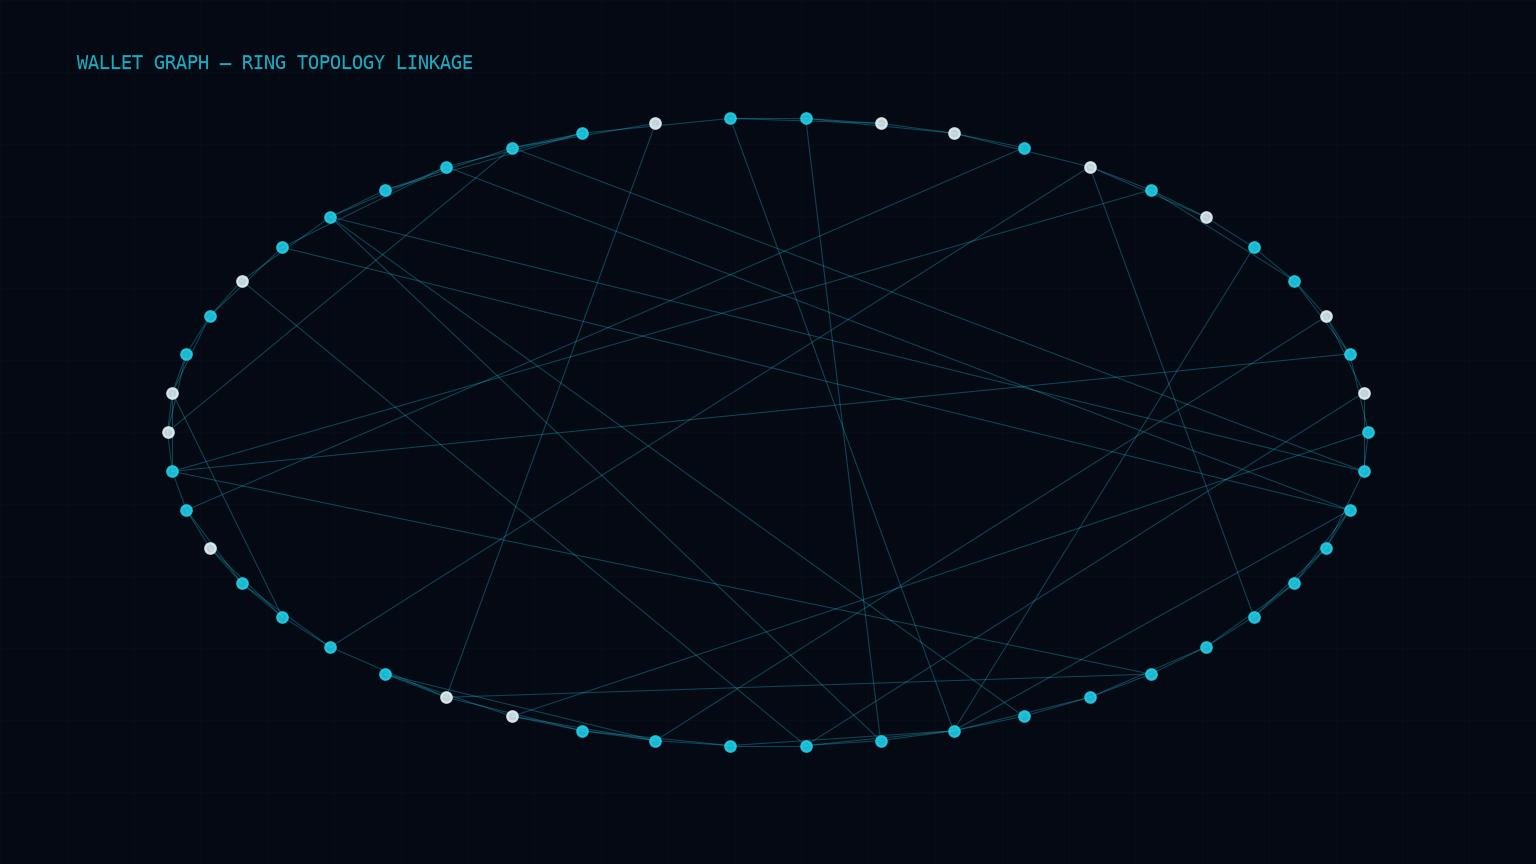
Wallet graph ring topology
Circular linkage patterns exposing coordinated address behaviour.
03 · Wallet & Entity Clustering
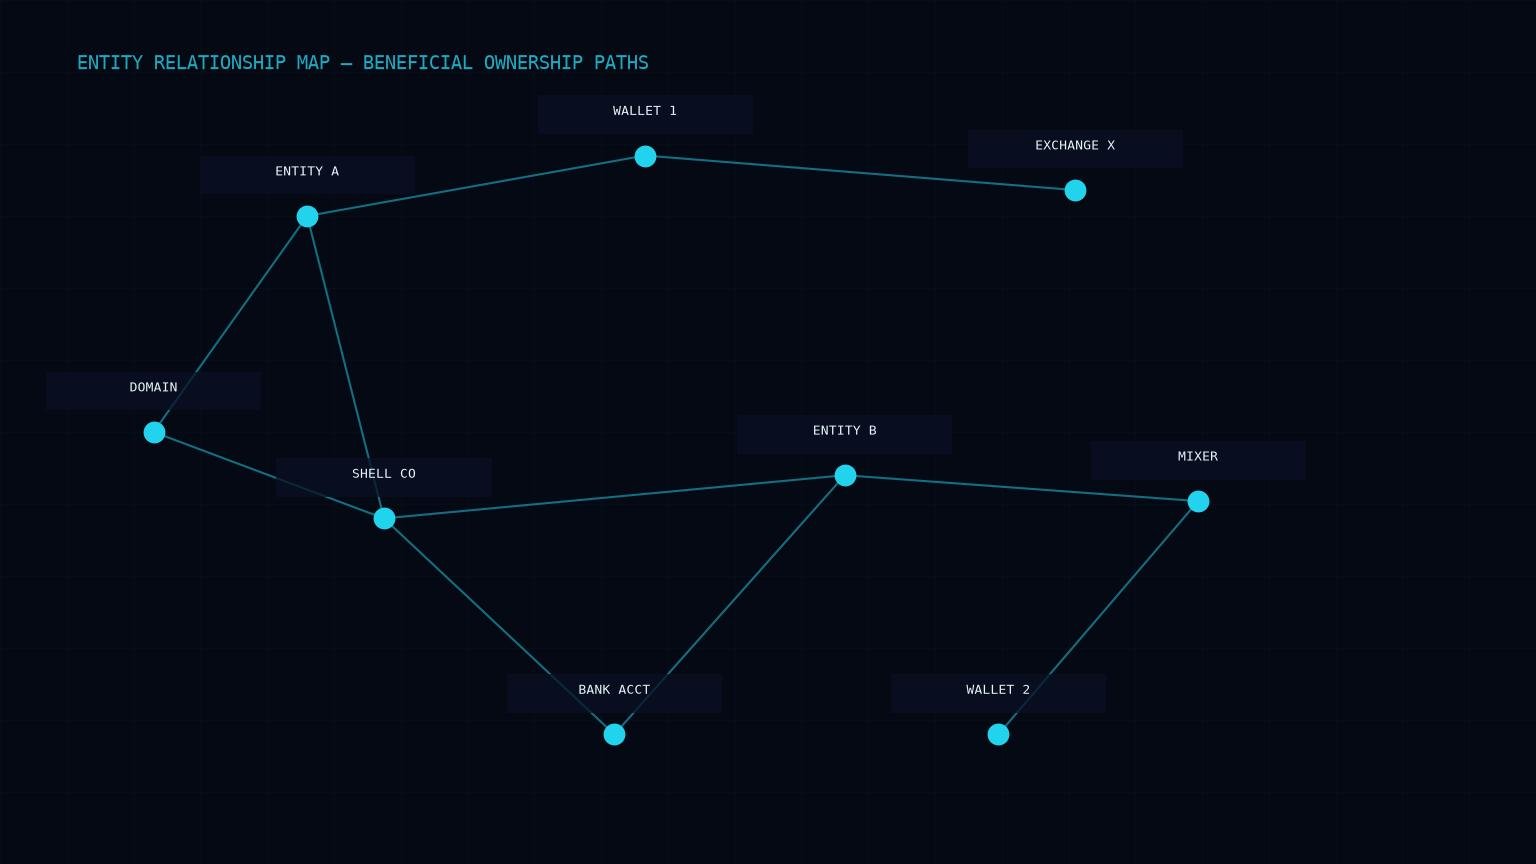
Entity relationship map
Wallets, shell companies and accounts connected into one structure.
04 · Wallet & Entity Clustering
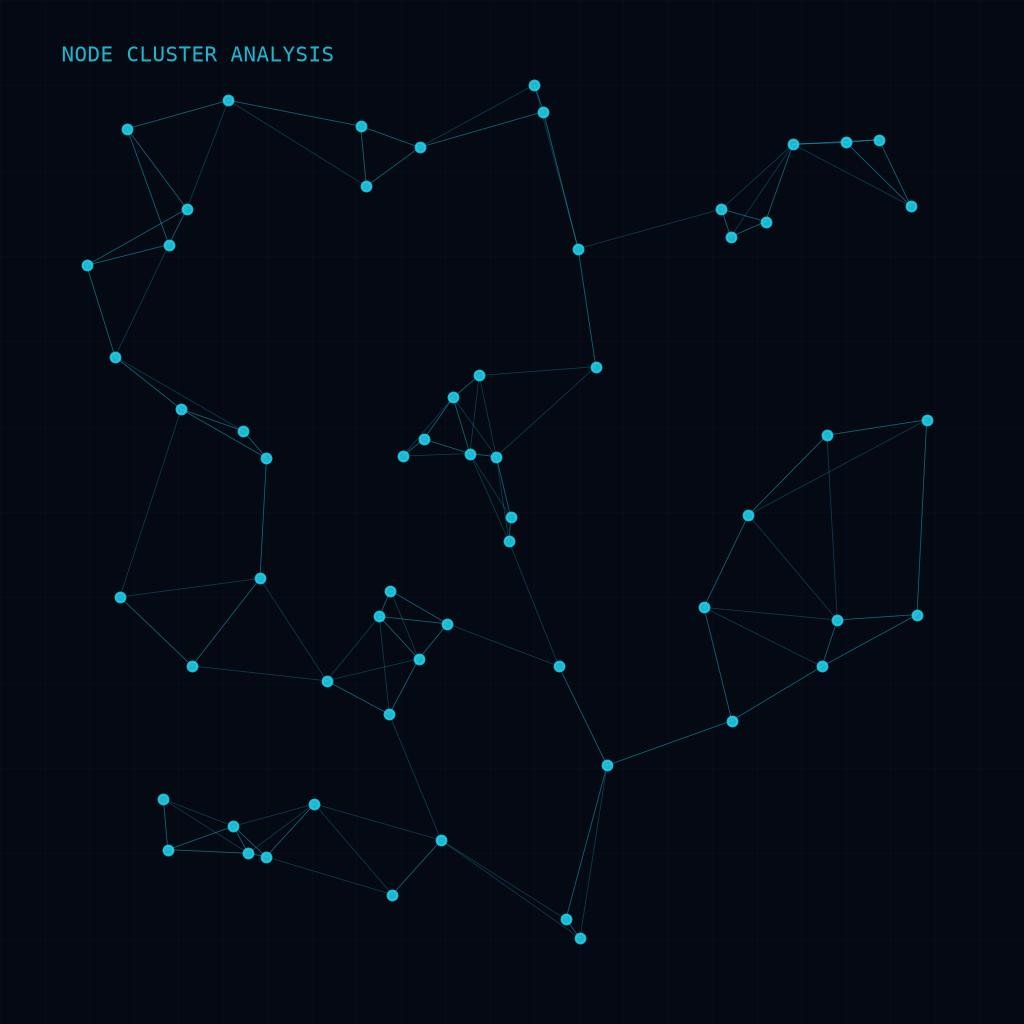
Node cluster analysis
Data points grouped by behavioural proximity across a network.
OSINT & Infrastructure Mapping
Correlating open-source signals with hosting and network infrastructure
Open-source intelligence converged with ASN and hosting topology to trace the infrastructure behind an operation across jurisdictions.
01 · OSINT & Infrastructure Mapping
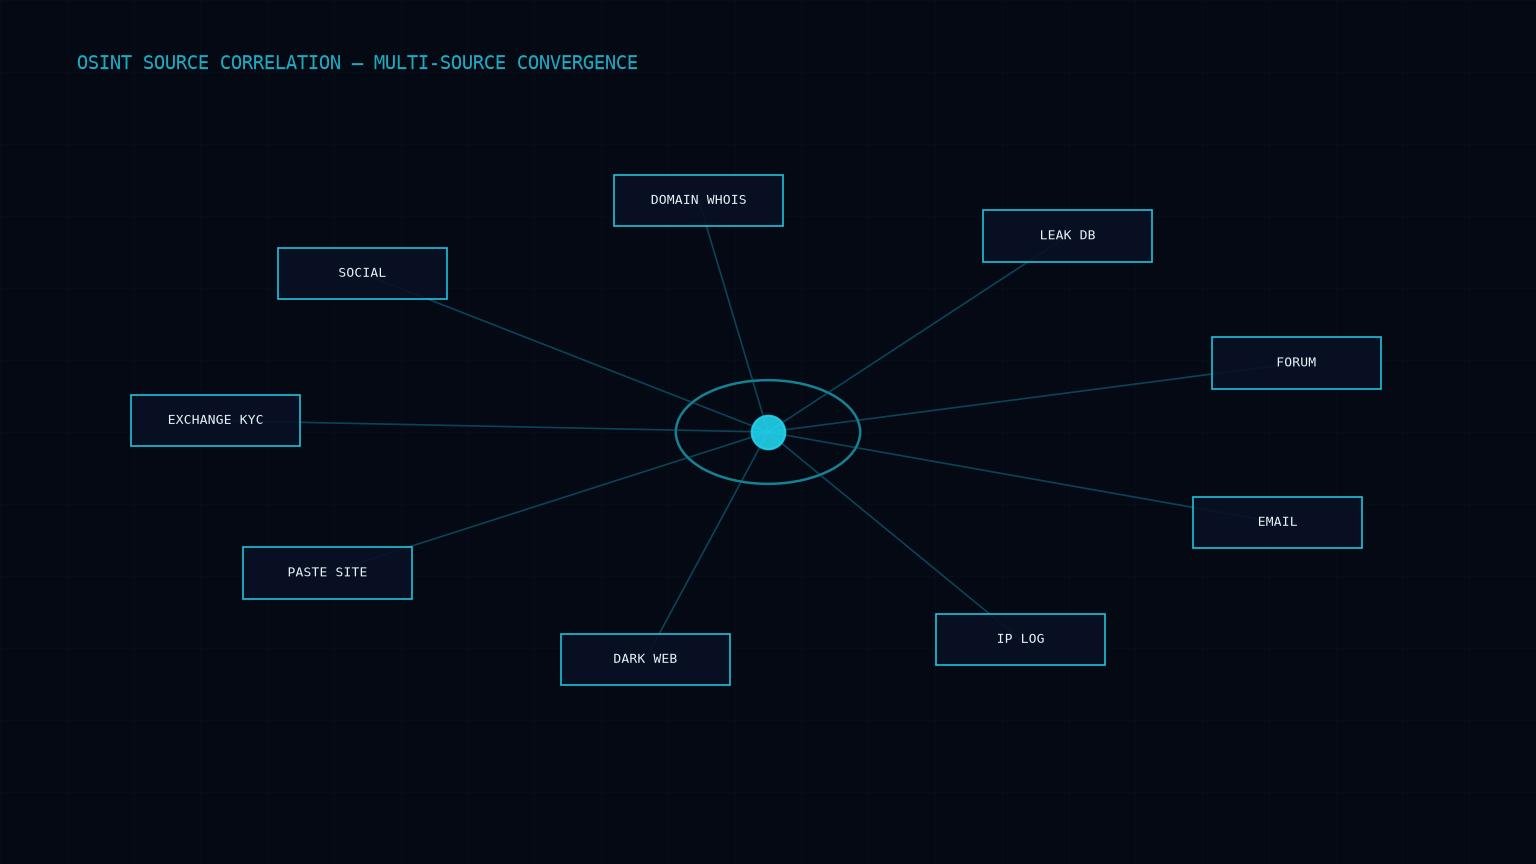
OSINT source correlation
Multiple open-source signals converging on a single entity.
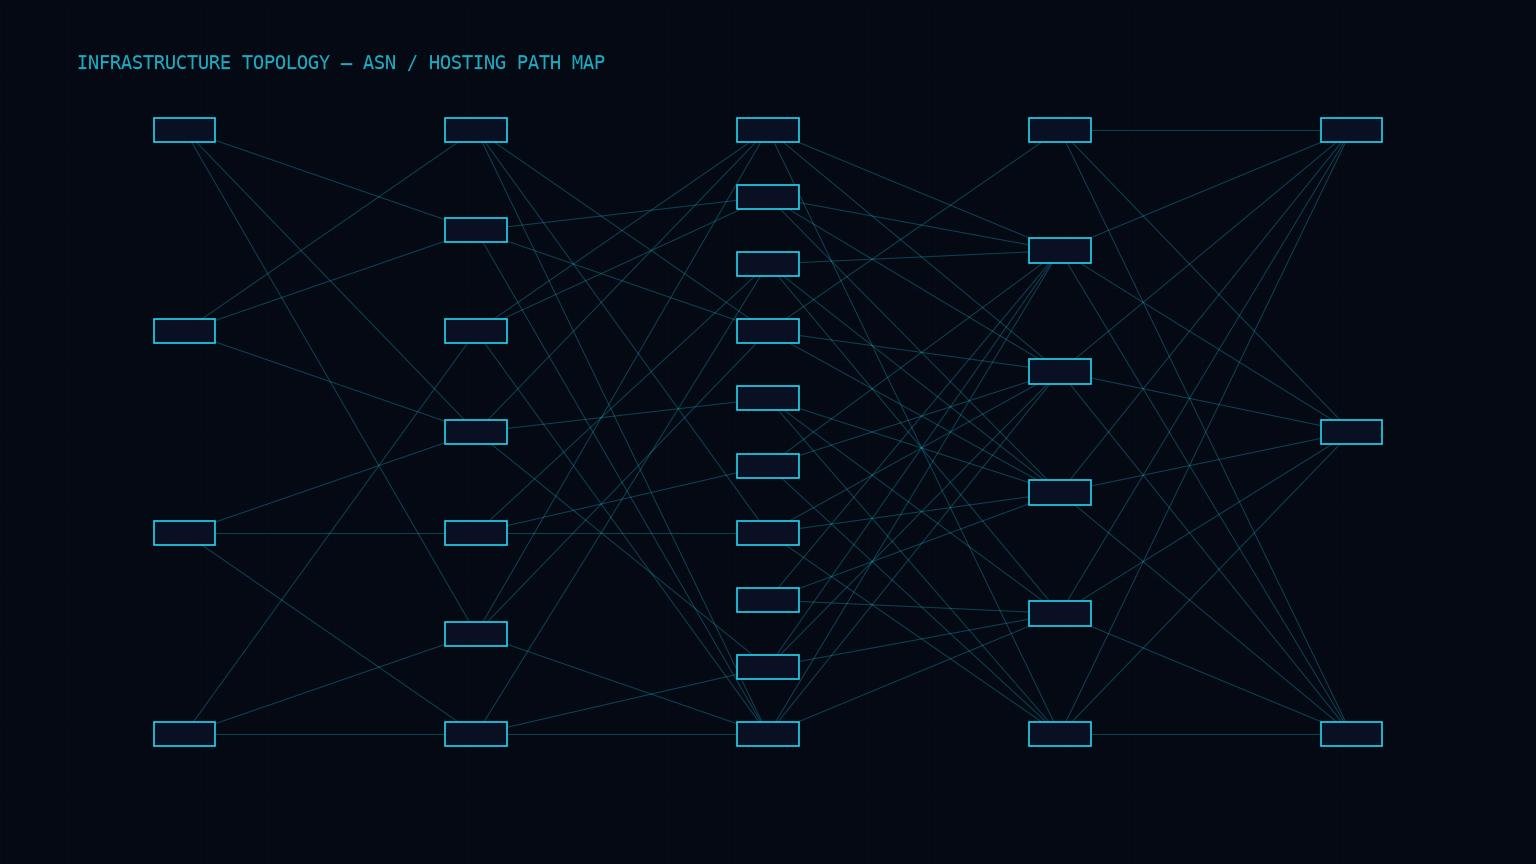
02 · OSINT & Infrastructure Mapping
Infrastructure and ASN topology
Hosting and network paths behind a suspect operation.
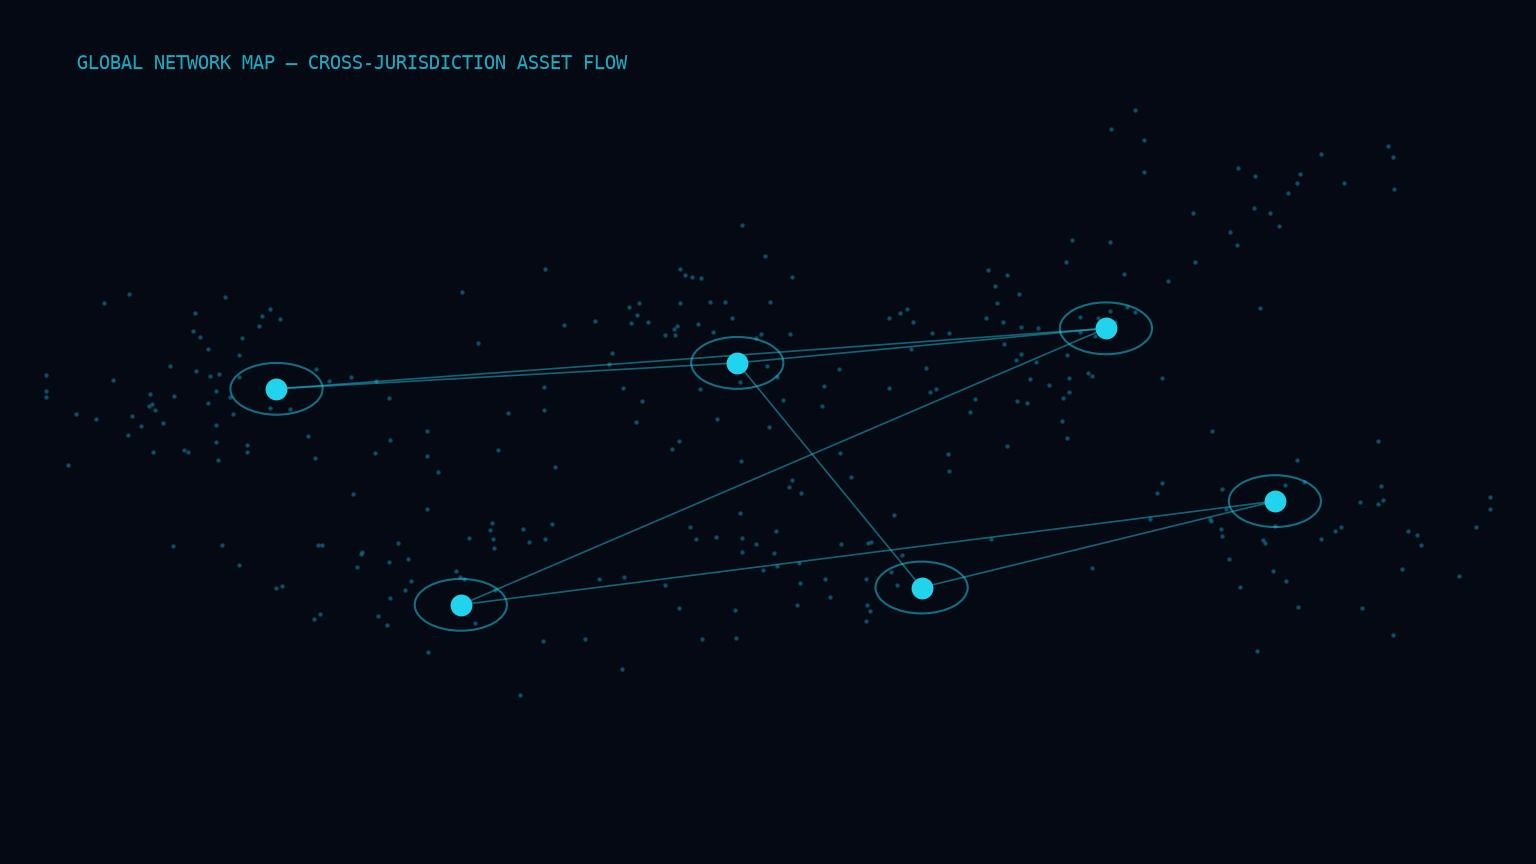
03 · OSINT & Infrastructure Mapping
Global network map
Cross-jurisdiction flow of digital assets between counterparties.
Evidence & Reporting
Building a chain-of-custody file that stands up to scrutiny
Timelines, exhibit-indexed reports and provenance chains document exactly how an asset moved and how it was traced.
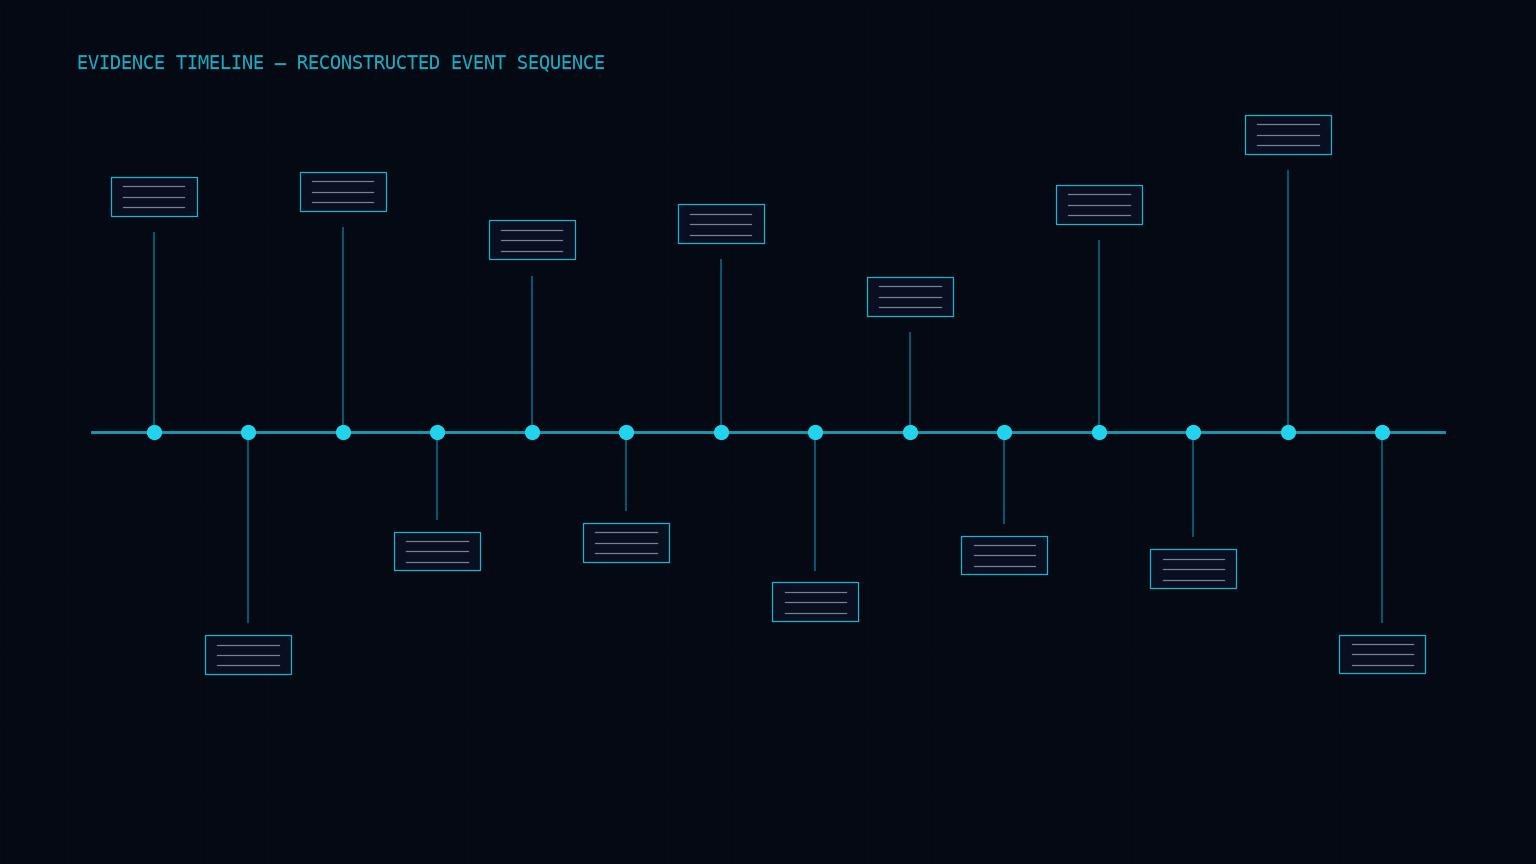
01 · Evidence & Reporting
Evidence timeline
The sequence of events reconstructed for a case file.

02 · Evidence & Reporting
Evidence report document
An exhibit-indexed report prepared for submission.
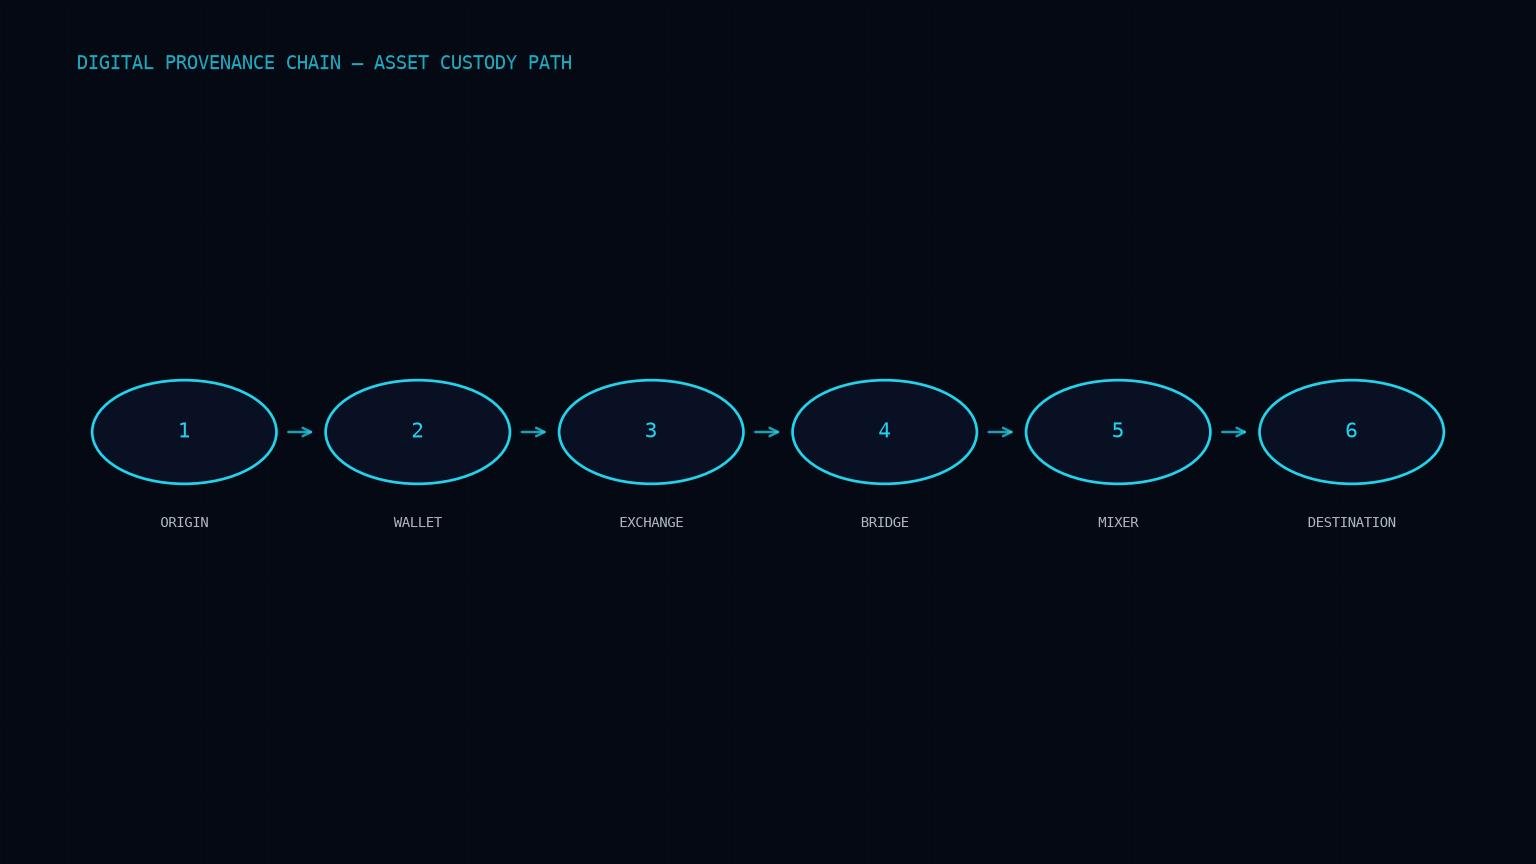
03 · Evidence & Reporting
Data provenance chain
Custody of a digital asset tracked from origin to destination.
Correlation Engines & Dashboards
Where automated analysis meets investigator judgement
Correlation engines and live case dashboards surface risk signals across encrypted, access-controlled case data.
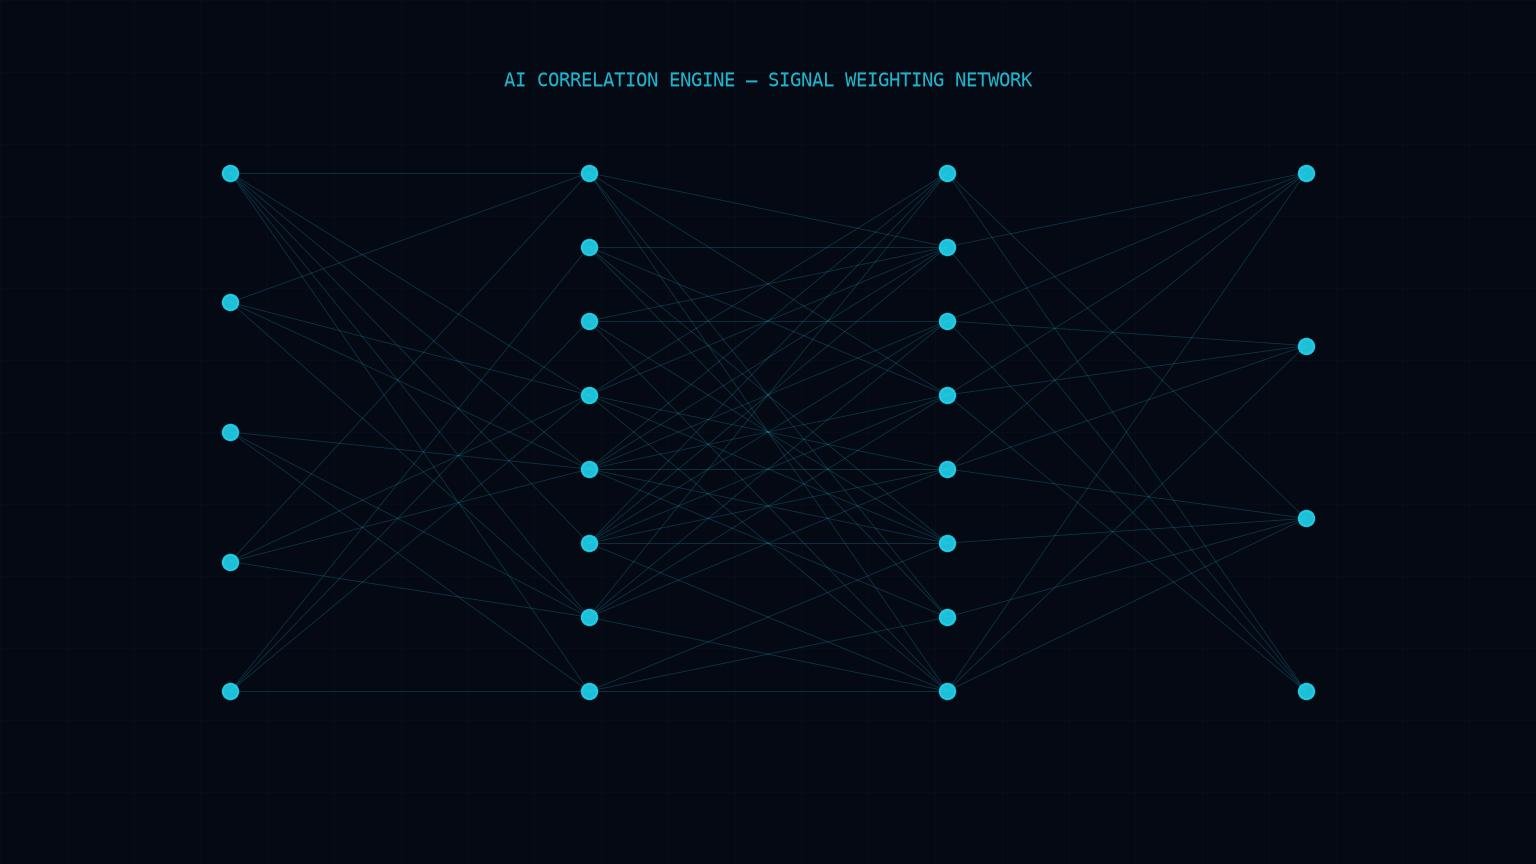
01 · Correlation Engines & Dashboards
AI correlation engine
Signals weighed across a multi-layer analysis network.
02 · Correlation Engines & Dashboards
Encrypted data lattice
Structured, access-controlled case data at rest.
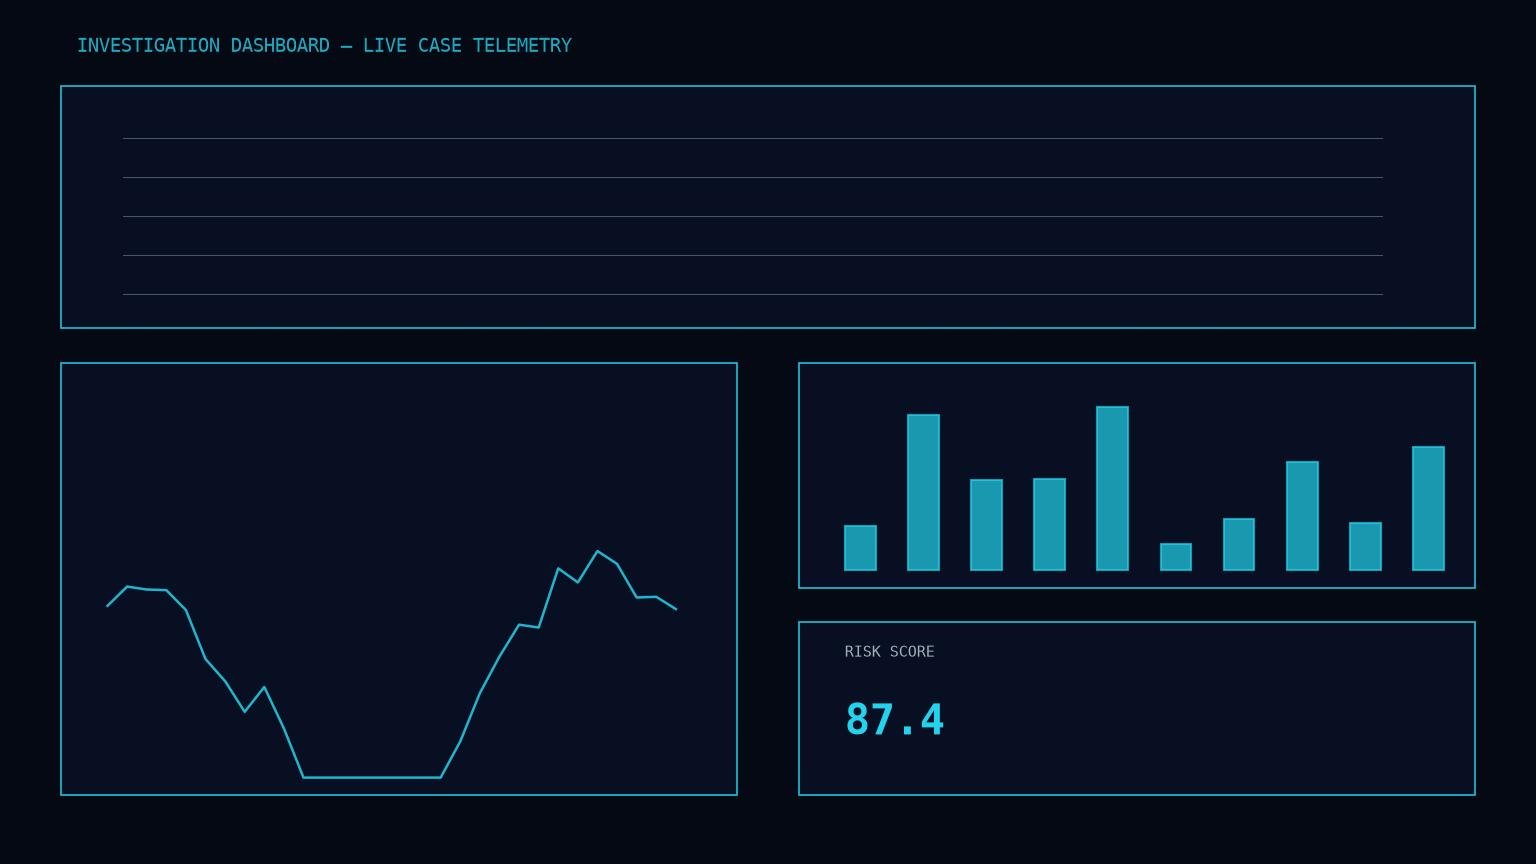
03 · Correlation Engines & Dashboards
Investigation dashboard
Live case telemetry, exposure and risk scoring in one view.
Ready to open a case?