Evidence Graphs · 6 April 2026 · 8 min read
How Evidence Graphs Connect Digital Records
By Digital Asset Claims Research Desk·Investigation Team
- Digital Evidence
- Evidence Graph
- Methodology
Evidence graphs give investigators, and readers of their reports, a structural way to see how digital records connect, without flattening every relationship into a single confident narrative line. This article explains how they are constructed and used.
A graph shows relationships and their supporting evidence side by side, which a linear narrative often cannot do as clearly.
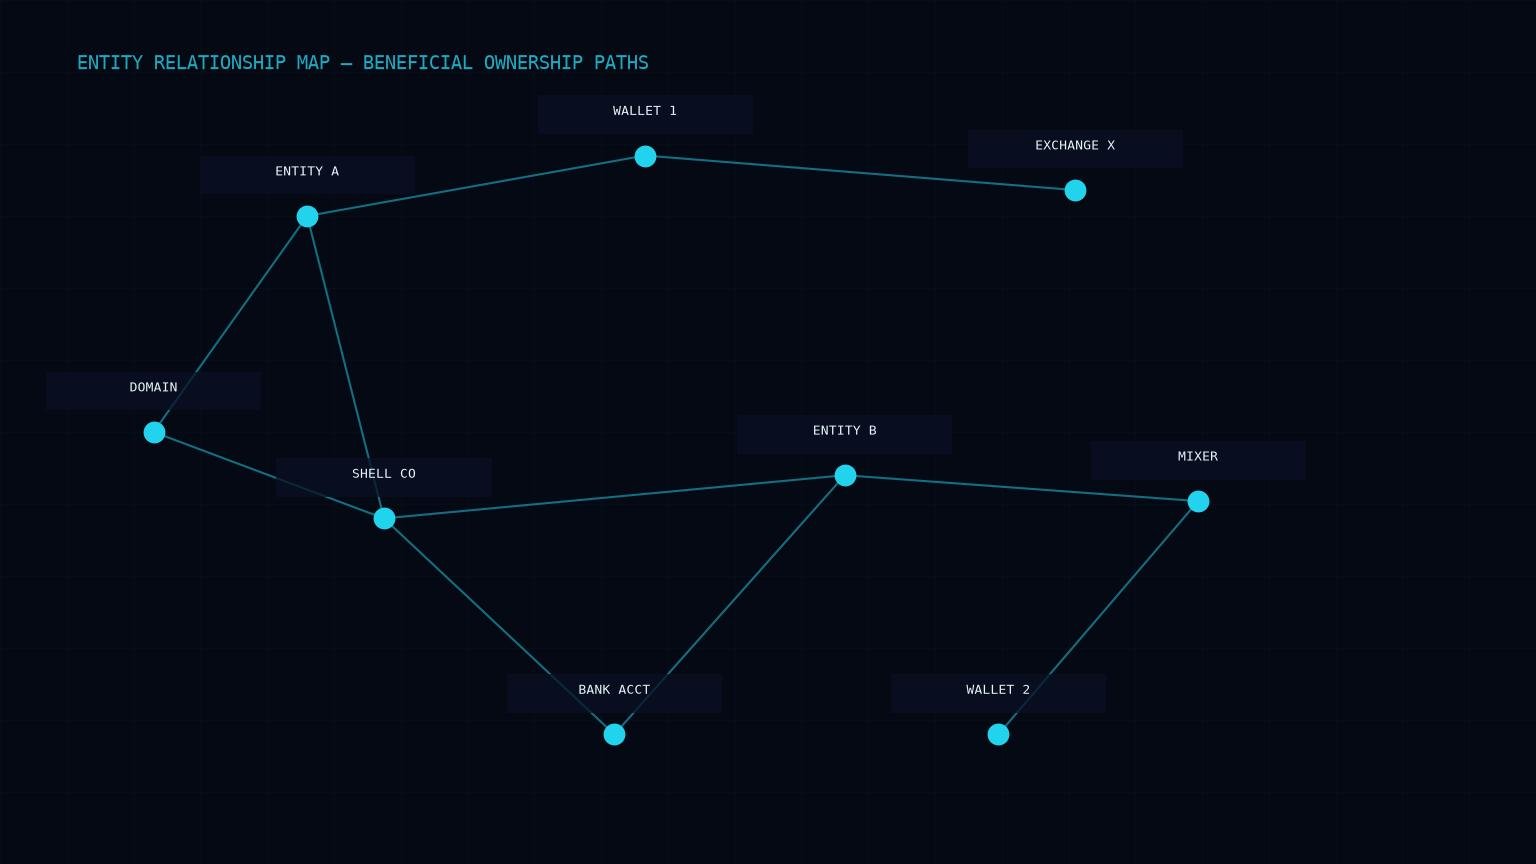
Nodes: representing discrete entities
Every node in an evidence graph represents a single, discrete entity, whether that is a wallet address, an exchange account, an email address, or a piece of infrastructure such as an IP address or autonomous system number.
Each node carries attributes sourced directly from verified records, and the source of each attribute is retained alongside it, so any later reviewer can check exactly where a given detail came from.
Nodes are added to the graph only once their underlying data has been verified, which keeps the graph's structure grounded in checked evidence rather than provisional leads that have not yet been confirmed.
Edges: representing relationships and their evidence
An edge connects two nodes and represents a specific, named relationship: a transaction, a shared login credential, a matching device fingerprint, or a documented business association, among other possibilities.
Every edge carries a confidence classification and a citation to the specific evidence supporting it, meaning the graph never presents a relationship without also showing how strongly, and on what basis, that relationship is asserted.
Where two entities appear related through more than one type of evidence, this is represented as multiple distinct edges rather than merged into one, preserving the individual strength of each supporting data point.
Building the graph from multiple data sources
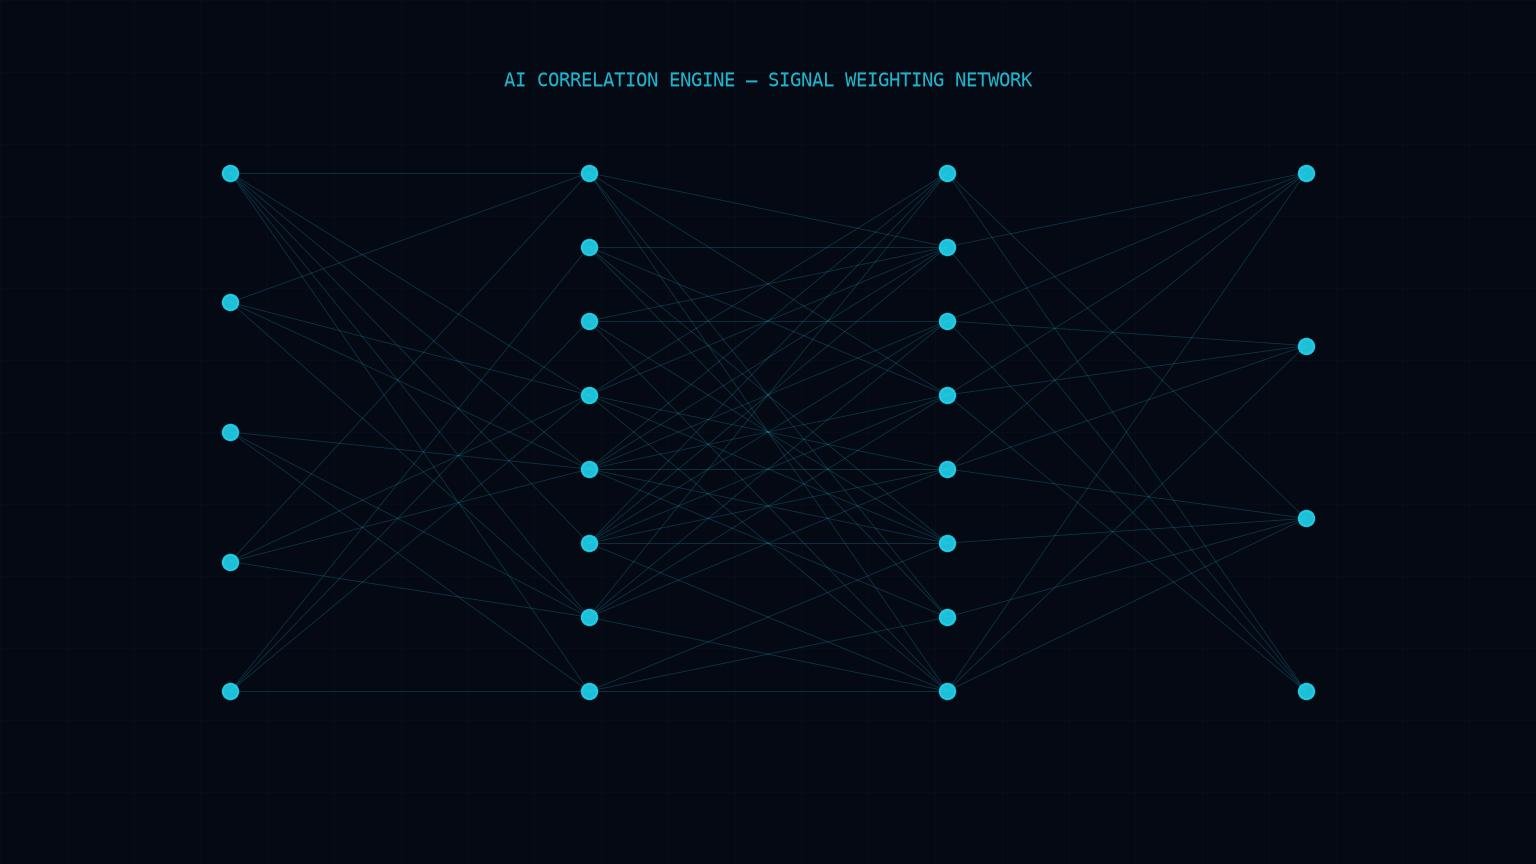
Constructing a usable evidence graph requires normalising data from disparate sources, on-chain explorers, exchange disclosures, infrastructure logs, and open-source material, into a common schema before relationships can be compared meaningfully.
This normalisation step is where errors are most likely to be introduced if not handled carefully, since timestamp formats, address encodings, and identifier conventions differ across sources and must be reconciled precisely.
Automated tooling assists with ingesting and normalising large volumes of data, but every candidate relationship it surfaces is manually reviewed before being confirmed as an edge in the working graph.
Using the graph to identify patterns
Graph analysis techniques, including centrality measures and cluster detection, can highlight nodes or groups of nodes that warrant closer investigation, such as an entity connected to an unusually high number of otherwise unrelated wallets.
These techniques generate leads, not conclusions. Any pattern identified through graph analysis is individually investigated and its supporting evidence separately verified before being included as a finding in the final report.
The graph is maintained as a living structure throughout the investigation, updated as new evidence changes existing confidence levels or adds new entities and relationships to the overall picture.
Components of an evidence graph and their evidentiary function
| Component | Represents | Evidentiary function |
|---|---|---|
| Node | A discrete entity such as a wallet, account, or IP | Anchors verified attributes to a single traceable object |
| Edge | A specific relationship between two entities | Carries confidence rating and supporting evidence |
| Cluster | A densely connected group of nodes | Surfaces candidate relationships for individual verification |
| Confidence tag | The strength of an edge's supporting evidence | Prevents flattening of uncertainty into a single narrative |
Frequently asked questions
Is an evidence graph the same as a narrative report?
No. The graph is a structural representation of entities and relationships, typically presented alongside, not instead of, a written narrative report.
How is confidence represented in a graph?
Each edge is tagged with a confidence classification and a citation to its supporting evidence, so the graph shows uncertainty explicitly rather than implying uniform certainty.
Can automated tools build the graph without review?
Automated tools assist with ingestion and pattern surfacing, but every candidate relationship is manually verified before being confirmed as an edge.
Does the graph change during an investigation?
Yes. It is updated continuously as new evidence is obtained, with confidence ratings revised to reflect the current state of the investigation.
Evidence graphs make the structure of an investigation visible: what is connected, how strongly, and on what evidence. That visibility is what allows complex digital asset cases to be reviewed, challenged, and relied upon with appropriate care.